Posts

Showing posts from 2012

Ice darkening in Greenland

Image
Greenland is an immense, glittering expanse of snow and ice. But in recent summers, satellites have been observing less “glitter” from the Northern Hemisphere’s largest ice expanse due to surface melt and other changes caused by warmer temperatures. The summer of 2012 found Greenland darker than it has been since ice-sheet-wide observations began in 2000. The darkest areas occurred around the perimeter of the island—the lowest elevations, where melting is most significant—but virtually the entire ice sheet showed below-average reflectivity. Courtesy: Climate Watch Magazine by NOAA http://www.climatewatch.noaa.gov/article/2012/less-glitter-greenland-ice-sheet-continued-to-darken-in-summer-2012 Map by NOAA Climate.gov team, based on NASA MODIS albedo data provided by Jason Box, The Ohio State University. Inset image is from NASA’s Terra satellite, courtesy the  LANCE MODIS Rapid Response Project.  Reviewed by Jason Box.

Global warming likely to be in the higher side

Image
Climate model projections that show a greater rise in global temperature are likely to prove more accurate than those showing a lesser rise. The study was published in the journal - Science. National Center for Atmospheric Research scientists John Fasullo and Kevin Trenberth analyzed how well 16 leading sophisticated climate models reproduce observed relative humidity in Earth's tropics and subtropics. They used observations from two NASA satellite instruments - the Atmospheric Infrared Sounder (AIRS) instrument on NASA's Aqua spacecraft and the Clouds and Earth's Radiant Energy System (CERES) . Climate model projections showing a greater rise in global temperature are likely to prove more accurate than those showing a lesser rise, according to them. Read in detail:  https://www2.ucar.edu/atmosnews/news/8264/future-warming-likely-be-high-side-climate-projections-analysis-finds http://www.nasa.gov/topics/earth/features/earth20121108.html

When Cirrus descends .......

Have you heard of Cirrus cloud descending .........? What is it ......? Is it a frequent phenomenon .....? Does it have seasonal dependence ....? Where does it occur ......? Why do cirrus descend .....? What is it's impact .......? We have discovered the phenomenon using 3 years of lidar observations over Thiruvananthapuram, near southern tip of India that Cirrus clouds frequently DESCEND.....! After analysing the data together with other observations and models, we have come up answers to the above questions.  The observations and results are now accepted by the scientific community and it finds a place in the Journal of Geophysical Research - JGR (Atmosphere). Read more... Here is the link:  http://www.agu.org/pubs/crossref/2012/2011JD017406.shtml   Nair, A. K. M. , K. Rajeev, M. K. Mishra, B. V. Thampi, and K. Parameswaran  ( 2012 ),  Multiyear lidar observations of the descending nature of tropical cirrus clouds ,...

Inexpensive and Efficient Solar Cell

Image
Hybrid graphene-quantum dot phototransistor. Image (c) Nature Nanotechnology (2012) doi:10.1038/nnano.2012.60 Engineers have used inexpensive materials to create a solar cell certified at a world-record 7.0 percent efficiency. The solar cell represents a 37 percent increase in efficiency over the previous certified record. A breakthrough in the development of colloidal quantum dot (CQD) films allowed the researchers from the University of Toronto and King Abdullah University of Science & Technology (KAUST) to develop the solar cell. Their work is featured in a letter published in Nature Nanotechnology. Here is the original article from Nature Nanotechnology (published last week of July,2012) http://www.nature.com/nnano/journal/vaop/ncurrent/pdf/nnano.2012.127.pdf Hybrid graphene–quantum dot phototransistors with ultrahigh gain, Nature Nanotechnology (2012) doi:10.1038/nnano.2012.60 Read more at:  http://phys.org/news/2012-05-group-highly-sensitive-photodetector-grap...

Equinox & Solstice - a better view

Image
Equinox & Solstice (view from Space).  Doesn't it convey better information than the usual cartoons.....?  I have taken the Satellite images from Meteosat via. Dundee satellite Receiving Station and made the matrix using GIMP.

Contrail - spreading.

Image
Have a look at these images, captured 2 hrs apart by MODIS of TERRA & AQUA. We can clearly decipher the transition of contrail to contrail cirrus clouds....... Increasing air pollution by planes is definitely pointing towards increase the in Longwave radiative forcing and thereby increasing the global warming potential.... Read more:  http://earthobservatory.nasa.gov/IOTD/view.php?id=78154 Image credit:  Jeff Schmaltz,  LANCE MODIS Rapid Response Team,  Goddard Space Flight Center. Caption by Adam Voiland., NASA earth observatory

Don't miss to watch the 'Transit of Venus'

Image
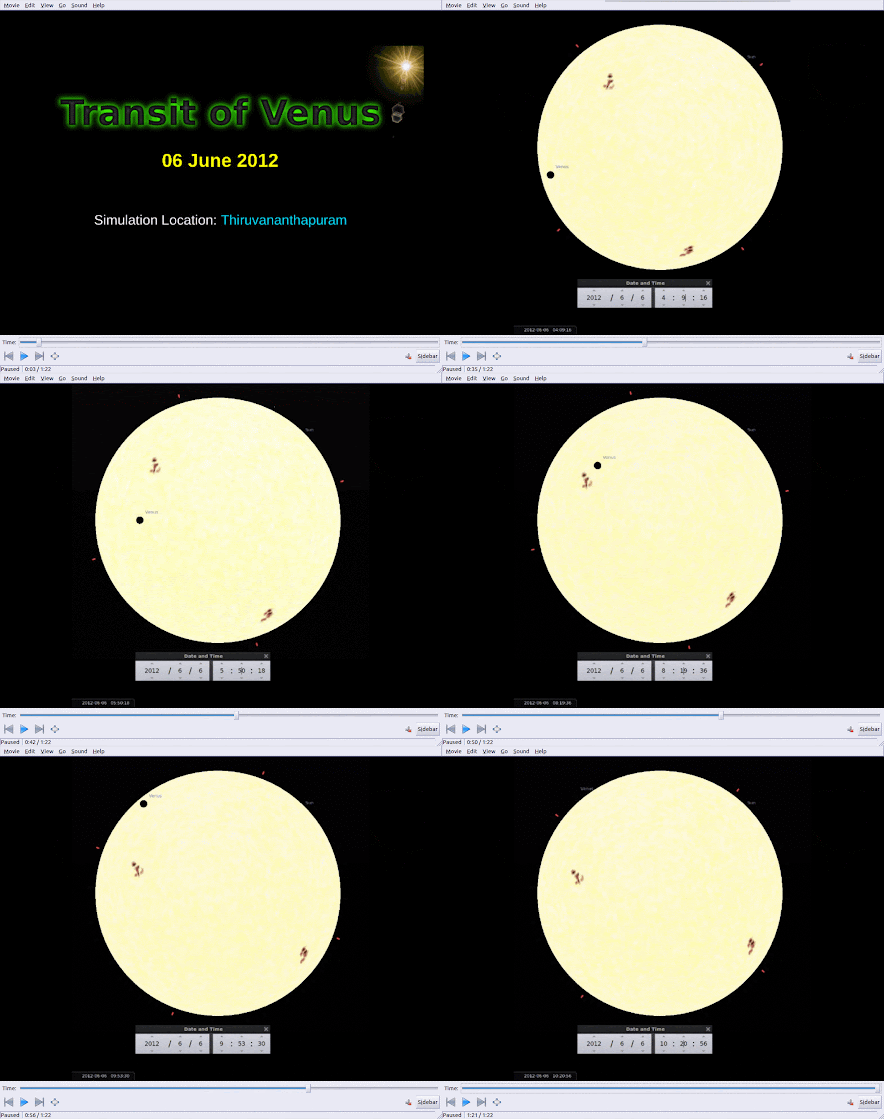
Be prepared to watch a heavenly drama on 6 June 2012. The Venus can be seen as a black dot travelling across the Solar Disk. Here is my Simulation: Yes, it is the "Transit of Venus across the Sun" Path-- L to R Credit: Michael Zeiler, eclipse-maps.com India comes under the visibility of the event after Sunrise. See the graphic below: Thiruvananthapuram can view it right from sunrise to 10:22 AM. The graphic was prepared using the tool provided in  http://transitofvenus.nl/wp/where-when/local-transit-times/   You can change the location and see about your visibility to the drama. Also read the following blog for wonderful information and graphics. http://blogs.esa.int/venustransit/        (nice and informative blog by ESA) http://eclipse-maps.com/Eclipse-Maps/Transits.html     (Transit maps) http://sunearthday.nasa.gov/transitofvenus/ You can also find how to watch the event.... Follow safe way.... take care ...

Controlling Climate Change - Geo-Engineering

Image
There are many proposals to reduce the climatic impact and change because of the Global Warming. Some of them tries to address the causative mechanism while some treats symptoms..... Geo-Engineering is d eliberate large-scale engineering and manipulation of the planetary environment to combat or counteract man made changes in atmosphere. Have a look at the three proposals to reduce increasing temperature. Click on the image of use the link below for a recent article in BBC. More details:  http://news.bbc.co.uk/2/hi/technology/8338853.stm

Modelling getting better .....

Clouds and aerosol particles have bedevilled climate modellers for decades. Now researchers are starting to gain the upper hand. Researchers say they are beginning to turn a corner in simulating clouds and aerosols. In recent months, climate scientists have started rolling out initial results from the newest generation of models, which represent atmospheric chemistry and microphysics in much more sophisticated ways than previous incarnations. These models allow clouds and aerosols to evolve as they interact with each other and respond to factors such as temperature, relative humidity and air currents.  Read more : http://www.nature.com/news/climate-forecasting-a-break-in-the-clouds-1.10593 Nature International weekly journal of science Go Advanced search

La Nina ends.

Image
La-Nina ended...... in April 2012. Pacific is in Neutral conditions....... See this animation......... Read More: http://earthobservatory.nasa.gov/IOTD/view.php?id=77828&src=youtube Animation CLICK HERE Courtesy: Nasa Earth Observatory

Lyrids Meteor Shower: don't miss the fireworks....!

Image
Lyrids Meteor Shower is round the corner..... Look up in the sky  to watch the Lyrids brighten the skies. On Saturday, April 21.  For the 2012 Lyrids meteor shower, a new moon will set darker skies that are ideal for meteor watching.  rid meteor shower will be viewable all over the world, with best rates seen just before dawn at the location where you're watching the skies. The Lyrids are very unpredictable, with peak meteor rates between 10-100 per hour.  Lyrids are pieces of debris from the periodic Comet C/1861 G1 Thatcher and have been observed for more than 2,600 years. In mid-April of each year, Earth runs into the stream of debris from the comet, which causes the Lyrid meteor shower. Read More:  http://www.nasa.gov/connect/chat/lyrids2012_chat.html

Earthquake - Real time information

Image
Real–time Earthquake Map can be seen from US Geological Survey Click here:  http://earthquake.usgs.gov/earthquakes/map/ Frequently Asked Questions (FAQ)  about the Current Earthquakes information General Information Earthquake Notification Service (ENS) The  Earthquake Notification Service (ENS)  is a free service that sends you automated notification emails when earthquakes happen in your area.

Precise neasurement of the universe

Image
Physicists on the Baryon Oscillation Spectroscopic Survey (BOSS)  have announced the first results  from their collaboration, revealing  the most precise measurements  ever made of the large-scale structure of the universe between five to seven billion years ago. They achieved this by observing the primordial sound waves that propagated through the cosmic medium a mere 30,000 years after the Big Bang. Read in detaill:  Most Precise Measurement of Scale of the Universe : Discovery News http://news.discovery.com/space/whos-the-boss-most-accurate-measurement-of-scale-of-the-universe-120406.html

Physics Video Lectures of MIT

Image
Here is the link to the excellent PHYSICS Video Lectures by Professor Walter Lewin of MIT. It's part of MIT Open Courseware...!! http://ocw.mit.edu/courses/physics/8-01-physics-i-classical-mechanics-fall-1999/video-lectures/ Professor Walter Lewin demonstrates that the period of a pendulum is independent of the mass hanging from the pendulum. This demonstration can be viewed on the video of Lecture 10. (Image courtesy of Markos Hankin, Physics Department Lecture Demonstration Group). Courtesy:   MIT

Hubble Telescope see globular cluster of Messier 9

Image
The Hubble Space Telescope has produced the most detailed image so far of Messier 9, a globular star cluster located close to the center of the galaxy. Beautiful glittering jewels....! Click on the Image or the following link to read more. http://www.nasa.gov/multimedia/imagegallery/image_feature_2204.html Credit: NASA and ESA

oh! No..! SOLAR Storm....!

Image
Space weather starts at the sun.  It begins with an eruption such as a huge burst of light and radiation called a solar flare or a gigantic cloud of solar material called a coronal mass ejection (CME) .  The effects of those eruptions happen at Earth, or at least near-Earth space. Scientists monitor several kinds of space "weather" events -- geomagnetic storms, solar radiation storms, and radio blackouts – all caused by these immense explosions on the sun. They cause wide disruptions in Radio communications, power blackouts but for the beautiful aurora..... Read more :  http://www.nasa.gov/mission_pages/sunearth/news/storms-on-sun.html http://www.nasa.gov/mission_pages/sunearth/spaceweather/index.html

Nasa to release TMA in 5 sounding rockets to study Jet Stream

Image
Nasa is gearing up to have 5 consecutive launches of sounding rockets which would releasr Tri-Methyl-Aluminum higher in the sky which would be acting like tracers in the Jet Stream. It would be tracked by the ground based cameras. A similar experiment was done by ISRO in Jan 2010 during the annular solar eclipse.   Read more: http://www.nasa.gov/mission_pages/sunearth/missions/atrex-nightlight.html

Ocean Surface Currents does not Cross the Equator. WHY ...?

Image
Lynne Talley, Physical Oceanographer, Climate, Atmospheric Sciences, and Physical Oceanography (CASPO) division, Scripps Institute of Oceanography answers..... It's because of the Vorticity Conservation which is related to Angular Momentum Conservation. Read the simple article in detail: http://explorations.ucsd.edu/for-kids/voyager/2012/voyager-why-dont-ocean-surface-currents-cross-the-equator/

Clouds Descending .....?

Image
Earth’s clouds descended a little — about one percent on average — during last decade, finds a new NASA-funded university study based on NASA satellite data.  The results have potential implications for future global climate. Decreasing global cloud heights suggest negative feedback over the last decade Data from NASA's MISR instrument on NASA's Terra spacecraft show that global average cloud height declined by about 1 percent over the decade from 2000 to 2010, or around 100 to 130 feet (30 to 40 meters). (Image credit: University of Auckland/NASA JPL-Caltech) The study was recently published in GRL. Global cloud height fluctuations measured by MISR on Terra from 2000 to 2010 Roger Davies & Matthew Molloy http://www.agu.org/pubs/crossref/2012/2011GL050506.shtml Read Reports: http://www.popsci.com/science/article/2012-02/earths-clouds-are-sinking-and-could-help-cool-planet http://www.clarksvilleonline.com/2012/02/22/nasa-satellite-finds-earths-clouds-are...

National Science Day- Feb 28

Image
National Science Day is celebrated in India on February 28 every year to celebrate  the discovery of Raman effect by C.V. Raman.  The event is commemorated in honour of Sir C.V. Raman for his legacy and discovery of the Raman Effect on February 28, 1927, for which he was awarded the Nobel Prize in 1930. The Raman Effect led to the growth of a new discipline, Raman Spectroscopy, which has now become a powerful tool for a wide range of scientific investigations and industrial applications.  Celebration of National Science Day began from 1986. Theme 2012: Clean ENergy Options & Nuclear Safety. http://www.nscdelhi.org/inauguration-science.php?event_id=302 Importance of Feb. 28 On February 28 1928, Sir C.V. Raman announced the discovery of the Raman Effect.  http://www.daysthatspeaks.com/india/science.html

can Rainfall calm Storms...?

Atmospheric scientists have found that Rainfall is able to calm the convectively unstable atmosphere....! They calculate that a substantial portion of the energy that drives wind and air circulation in the atmosphere is dissipated as friction by raindrops falling through the air. Some of the dissipation of mechanical energy happens when a falling raindrop (or snowflake or hailstone) experiences friction as it passes through the surrounding air. Read more:  http://www.nature.com/news/rainfall-calms-storms-1.10100

Global Tree Height prepared.

Image
NASA produces Global map of forest height using ICESat. The map will help scientists better understand the role forests play in climate change and how their heights influence wildlife habitats within them, while also helping them quantify the carbon stored in Earth's vegetation. Click on the image to Zoom The map, available at http://lidarradar.jpl.nasa.gov, depicts the highest points in the forest canopy. Its spatial resolution is 0.6 miles (1 kilometer). Courtesy:  http://www.nasa.gov/topics/earth/features/forest20120217.html

Visualize Scale sizes...

Here is an interesting and  informative interactive information on the scale sizes...... http://images.4channel.org/f/src/589217_scale_of_universe_enhanced.swf from ultra small quarks to ultra big universe.....

mystery of Earth's 'missing energy' -solved..?

An apparent inconsistency has been diagnosed between interannual variations in the net radiation imbalance inferred from satellite measurements and upper-ocean heating rate from in situ measurements, and this inconsistency has been interpreted as ‘missing energy’. Where was it going? Now Scientists come up with an answer..... "Missing Energy" is in the Ocean  "Our data show that Earth has been accumulating heat in the ocean at a rate of half a watt per square meter (10.8 square feet), with no sign of a decline," Loeb said. "This extra energy will eventually find its way back into the atmosphere and increase temperatures on Earth." Read more: http://www.jpl.nasa.gov/news/news.cfm?release=2012-029 http://www.dailymail.co.uk/sciencetech/article-2093947/Nasa-solves-mystery-Earths-missing-energy--going-sea-says-space-agency.html?ito=feeds-newsxml Paper:  http://www.nature.com/ngeo/journal/vaop/ncurrent/full/ngeo1375.html#/access doi:10.1038/ngeo...

Cold plasma escaping from earth

COLD PLASMA LAYER DETECTED HIGH ABOVE EARTH The new findings suggest that about two lbs. (1 kilogram) of cold plasma escape from Earth's atmosphere every second. As physicists further map cold plasma around Earth, they could discover more about how it reacts during solar storms and other events, deepening our understanding of space weather. Read more:  http://news.discovery.com/earth/earth-cold-plasma-layer-found-120127.html#mkcpgn=rssnws1

2011 Ninth-Warmest Year on Record

Image
The global average surface temperature in 2011 was the ninth warmest since 1880, according to NASA scientists. Observe an updated analysis that shows temperatures around the globe in 2011 compared to the average global temperature from the mid-20th century. http://www.nasa.gov/topics/earth/features/2011-temps.html  The average temperature around the globe in 2011 was 0.92 degrees F (0.51 C) warmer than the mid-20th century baseline. "We know the planet is absorbing more energy than it is emitting," said GISS Director James E. Hansen. "So we are continuing to see a trend toward higher temperatures. Even with the cooling effects of a strong La Niña influence and low solar activity for the past several years, 2011 was one of the 10 warmest years on record." Animation can be seen here, http://www.nasa.gov/mp4/616923main_GISStemperature2011_withColorbar.mp4 Understand  More: http://www.nasa.gov/topics/earth/features/2011-temps.html# http://data.giss.nasa.go...

Our Recent Paper in JASTP

Image
Journal of Atmospheric and Solar-Terrestrial Physics Volume 74 , January 2012, Pages 232–237 Impact of a noon-time annular solar eclipse on the mixing layer height and vertical distribution of aerosols in the atmospheric boundary layer Manoj Kumar Mishra,  K. Rajeev ,  ,  Anish Kumar M. Nair,  K. Krishna Moorthy,  K. Parameswaran For full paper, click this link:  http://dx.doi.org/10.1016/j.jastp.2011.10.012 , Abstract Impact of the long duration noontime annular solar eclipse on 15 January 2010 on the vertical distribution of aerosols and mixing layer height ( H M ) in a well-developed convective atmospheric boundary layer (ABL) has been investigated using continuous Lidar observations over a tropical coastal station, Thumba (8.5°N, 76.9°E). This study shows that  H M  has decreased from its peak value of ∼1800 m at 12:00 h to ∼1000 m following the annular phase of the eclipse (13:17 h), whil...

Scientific Programming

Python is a scientific language which combines remarkable power with clean, simple and easy-to-understand syntax. That some of the most robust scientific packages have been written in Python makes it a natural choice for scientific computational tasks. Although tools like Mathematica and Matlab remain commercial, the open source community has also developed some equally powerful computational tools, which can be easily used by students and independent researchers. These tools are so robust that they are now also used at educational institutions and research labs across the globe. Read more : http://www.linuxforu.com/2011/05/what-is-scientific-programming/

Size of the Moon in Perigee & Apogee

Image
Photographer :  Anthony Ayiomamitis At  apogee , the  Moon  is on average approximately 406,500 km (252,587 mi) away from Earth with an apparent diameter of about 29.5  arc-minutes  (about one half degree); whereas at  perigee , the Moon is approximately 356,500 km (221,500 mi) distant and has an apparent diameter of about 33.6 arc-minutes. This difference of 50,000 km (31,069 mi) between apogee and perigee results in a dramatic change in the apparent diameter as illustrated by the two  full Moons  above, photographed in 2010. These particular full Moons were strategically selected to have the full Moon as near as possible to its minimum perigee and maximum apogee when crossing the local meridian in Athens, Greece. The Moon photo at left was taken on January 30, 2010 (at 00:31:28 local time) and the Moon at right was snapped on August 25, 2010 (01:26:33 local time). Courtesy: http://epod.usra.edu/blog/2011/03/full-moon-...

Greenland ICE becoming DARKER ....?

Image
The bright surface of the Greenland Ice Sheet reflected well over half of the sunlight that fell on it. This reflectiveness helped keep the ice sheet stable. In the past decade, however, satellites have observed a decrease in Greenland’s reflectiveness. This darker surface now absorbs more sunlight, which accelerates melting.  difference between the amount of sunlight Greenland reflected in the summer of 2011 versus the average percent it reflected between 2000 to 2006. Warmer, lower-elevation areas of the ice sheet have darkened more than the colder, higher-altitude interior. Each summer, winter snow retreats from the edge of the ice sheet. Dark pools of melt water form on the surface of the ice, and windblown dust and other particles also collect near the surface, making it even less reflective. Jason Box of Ohio State University, who analyzed the reflectiveness data propose that ice itself undergone change in shape and structure... Read more here :  http:/...

Global warming can delay next glaciation :o

Global warming caused by greenhouse gases delays natural patterns of glaciation suggests a study co-authored by a University of Florida researcher and published online Jan. 8 in Nature Geoscience. The Earth's current warm period that began about 11,000 years ago should give way to another ice age within about 1,500 years, according to accepted astronomical models. However, current levels of carbon dioxide are trapping too much heat in the atmosphere to allow the Earth to cool as it has in its prehistoric past in response to changes in Earth's orbital pattern. data indicate that the next ice age will likely be delayed by tens of thousands of years. Good news ...?                 NO! Ice sheets like those in western Antarctica are already destabilized by global warming, they eventually slough off and become a part of the ocean's volume, it will have a dramatic effect on sea level. Read more here :  http://www.physorg.com/news/...